Investment banking
Piper Sandler. Hieu Van Nguyen, Investment Banking Associate, June 2021 to February 2024
Investment Banking Associate
June 2021 to February 2024. Minneapolis, Minnesota.
15+
live sell-side processes run end to end
$1B+
total transaction value
35 to 40%
of the team's business-development output
What I did
Ran 15-plus live sell-side M&A processes end to end, from valuation to close, across healthcare, medical technology and diversified industries, totaling more than $1 billion in transaction value.
Served as deal lead on concurrent mandates for founder- and PE-owned sellers, directing diligence, modeling and management presentations and acting as the seller's day-to-day lead through close.
Was the technical authority on valuation for deal teams, building the LBO, DCF and comparable analyses that senior bankers and clients made decisions on.
Generated roughly 35 to 40 percent of the team's business-development output alongside senior bankers, and built the bench by recruiting, training and mentoring its analysts and summer associates.
Models I work with
LBO
Leveraged buyout analysis that senior bankers and clients made decisions on.
DCF
Discounted cash flow valuation behind sell-side mandates.
Comparable analyses
Comparable analyses across healthcare, medical technology and diversified industries.
Process management
Valuation, diligence, modeling and management presentations from launch to close.
Sample build: leveraged buyout returns
A five-year buyout of a company with $50M of EBITDA. Cash flow pays down debt each year, and the equity return comes from growth, debt paydown and the change in multiple. Move the sliders and the sensitivity table updates.
Synthetic inputs for illustration. Not data from any employer.
Annual return (IRR)
16.0%
Multiple of equity
2.10x
Equity invested
$260M
Equity at exit
$547M
| Item | Amount |
|---|---|
| Enterprise value | $500M |
| Fees | $10M |
| Debt | $250M |
| Equity | $260M |
| Entry (rows) and exit (columns) | 9.0x | 10.0x | 11.0x |
|---|---|---|---|
| 9.0x | 18.1% | 21.2% | 24.0% |
| 10.0x | 13.0% | 16.0% | 18.7% |
| 11.0x | 9.0% | 11.9% | 14.6% |
Buying at 10.0x EBITDA and selling at 10.0x after 5 years returns 16.0% a year and 2.10x the equity invested.
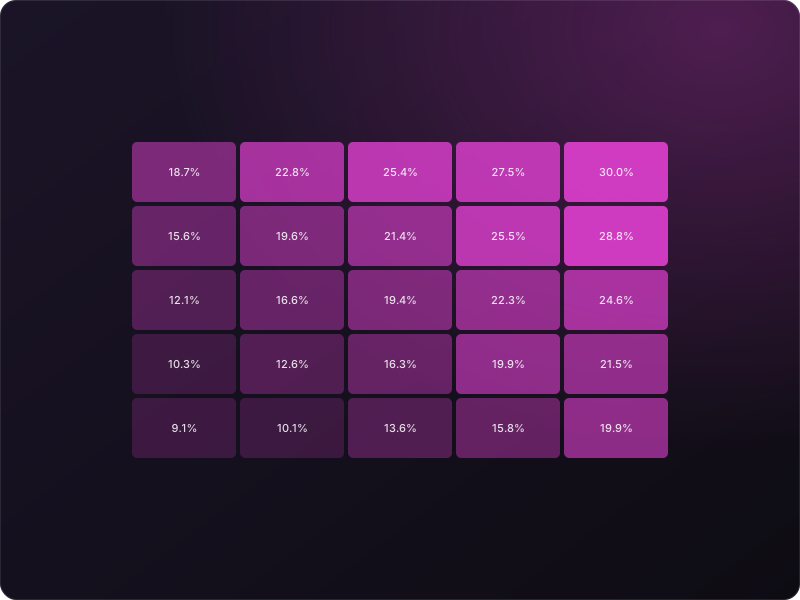
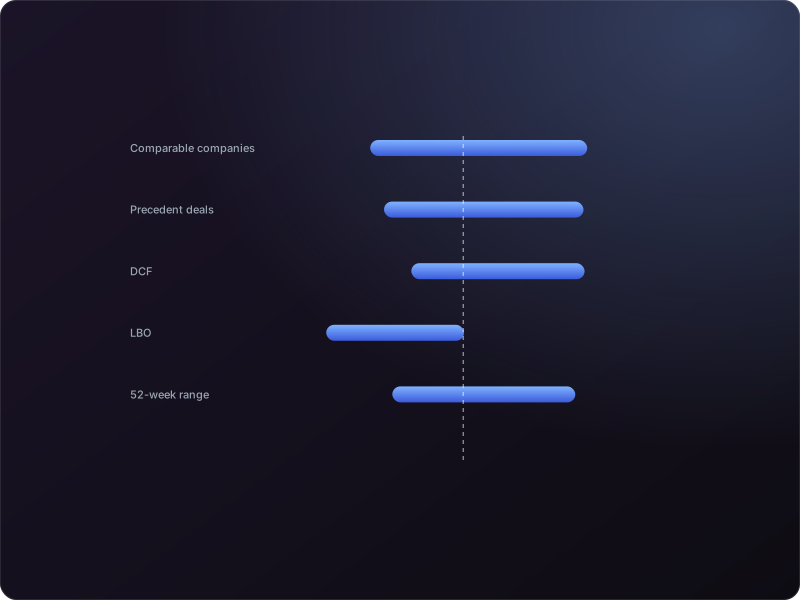

Illustrative visuals drawn from synthetic data. None of the numbers in them come from an employer.