M&A consulting
Accenture. Hieu Van Nguyen, Strategy & Consulting Senior Analyst, M&A (Early Promotion), March 2020 to June 2021
Strategy & Consulting Senior Analyst, M&A (Early Promotion)
March 2020 to June 2021. Minneapolis, Minnesota.
15 to 25%
purchase-price improvements from diligence and valuation
Five
people on the task force that uncovered a fraudulent-identity scheme
What I did
Executed buy-side acquisitions across healthcare, financial services and the public sector, leading the diligence and valuation that delivered 15 to 25 percent purchase-price improvements.
Led market analysis and integration work that drove synergy capture across the firm's acquisition portfolio.
Directed a five-person task force that uncovered a fraudulent-identity scheme in state unemployment claims, protecting millions in public funds.
Models I work with
Buy-side valuation
Valuation and diligence that delivered 15 to 25 percent purchase-price improvements.
Integration and synergy
Market analysis and integration work that drove synergy capture.
Fraud investigation
A five-person task force that uncovered a fraudulent-identity scheme in state unemployment claims.
Sample build: synergy value and walk-away price
A buyer values a target on its own, adds the value of the cost savings after integration costs, and decides how much of that value to pay away. The result is a walk-away price to hold against the seller's opening ask.
Synthetic inputs for illustration. Not data from any employer.
Seller's ask
$400M
Value without savings
$360M
Value of savings, net
$34.4M
Walk-away price
$377M
| Improvement | Price | Times EBITDA | Value kept |
|---|---|---|---|
| 5% | $380M | 9.50x | $14M |
| 10% | $360M | 9.00x | $34M |
| 15% | $340M | 8.50x | $54M |
| 20% | $320M | 8.00x | $74M |
| 25% | $300M | 7.50x | $94M |
The ask of $400M is $23M above the walk-away price of $377M, so the buyer has room to negotiate it down 5.7%.


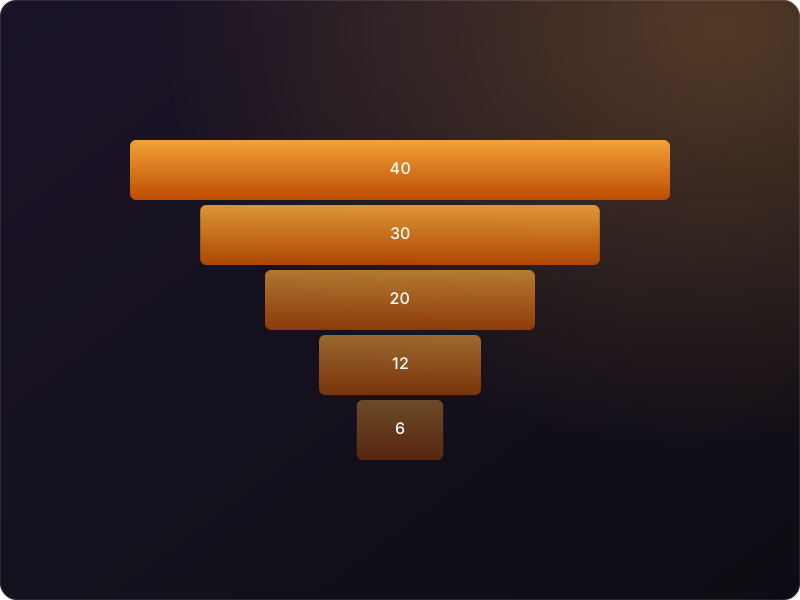
Illustrative visuals drawn from synthetic data. None of the numbers in them come from an employer.