Divisional FP&A
Ecolab. Hieu Van Nguyen, FP&A Lead, February 2024 to February 2025
FP&A Lead
February 2024 to February 2025. Minneapolis, Minnesota.
$3B+
global life-sciences and healthcare division
Four days to under fifteen minutes
the division's monthly reporting cycle, before and after
What I did
Served as the FP&A lead for a $3 billion-plus global life-sciences and healthcare division, owning its budgeting, forecasting and variance, and writing the financial story that reached the C-suite, the board and investor relations.
Cut the division's monthly financial reporting cycle from roughly four days to under fifteen minutes and made it more reliable.
Advised the commercial organization on pricing, competitive position and territory strategy, and rebuilt the business-case approval process to move decisions through senior leadership faster.
Models I work with
Budget, forecast and variance
Planning and variance for a $3 billion-plus global life-sciences and healthcare division.
Executive reporting
The financial story that reached the C-suite, the board and investor relations.
Reporting automation
A monthly cycle cut from roughly four days to under fifteen minutes.
Commercial analysis
Pricing, competitive position and territory strategy for the commercial organization.
Sample build: budget to actual variance bridge
Revenue against budget, split into price, volume, mix and currency. The commentary underneath writes itself from the inputs, which is how a monthly reporting cycle gets short.
Synthetic inputs for illustration. Not data from any employer.
Budget
$100M
Actual
$101.4M
Variance
+$1.4M
1.4%
| Driver | Effect |
|---|---|
| Price | +1.8 |
| Volume | -0.6 |
| Mix | +0.9 |
| Currency | -0.7 |
| Total variance | +1.4 |
Revenue is $1.4M (1.4%) above the $100M budget. Price is the largest driver at +$1.8M, then mix +$0.9M, currency -$0.7M, volume -$0.6M.

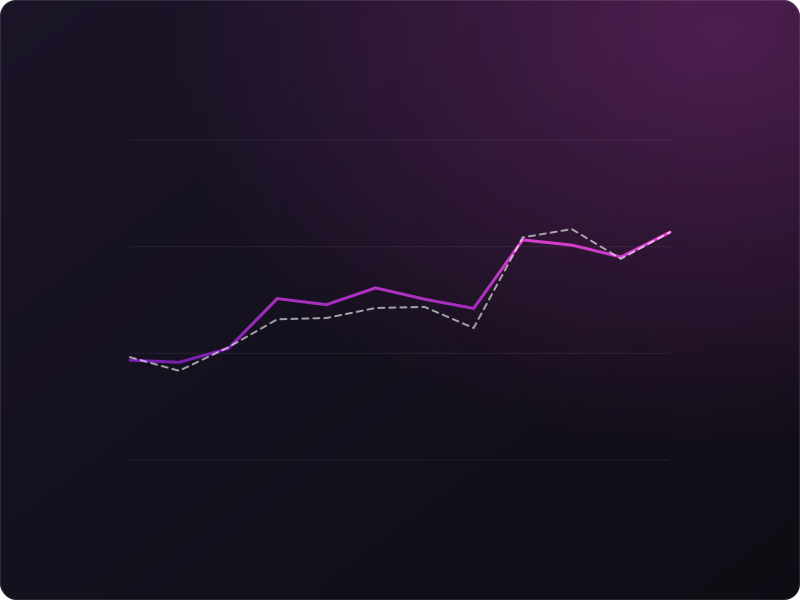

Illustrative visuals drawn from synthetic data. None of the numbers in them come from an employer.